Monsoon Update & 4th of July Mountain Forecast

Tomer’s Take: Monsoon Season normally runs July-August across the Rockies. I’m forecasting a late start. Data suggest it might not start until after 7/10. A large dome of high pressure is currently blocking the flow. But, even without Monsoon moisture, afternoon thunderstorms are still possible over higher terrain from daytime heating and fronts racing through. Wetter than normal conditions remain likely for WY, MT, ID, and NE CO through 7/11 with an active jet stream.

What is the Seasonal Monsoon? It’s extra moisture from the Gulf and Pacific that streams into the West making afternoon thunderstorms more likely with frequent lightning, flash flooding, gusty wind, and hail.

El Nino Contribution: Data suggest that El Nino can disrupt and weaken the North American Monsoon.

Current Pattern – Monsoon Blocked

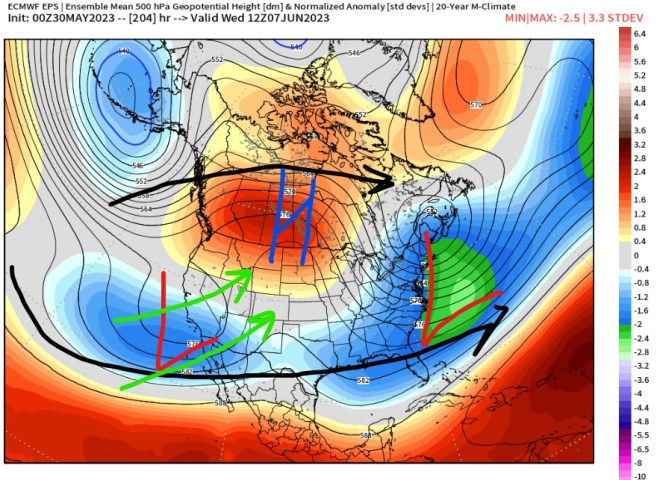
Red/orange = drier air. A dome of high pressure over Mexico is blocking the moisture flow. Normally, winds turn southerly and escort rich moisture into the United States. How long will this high pressure last? At least until 7/10. But, notice the jet stream flow running west to east across the West. This will deliver several fronts to the Rockies and keep afternoon thunderstorms going.

Valid 7am 6/27/2023:

Forecast Pattern

Valid: 6/27 – 7/11

Drier than normal precip anomalies remain in place through 7/11 for NM, AZ, SW CO, UT. Wetter than normal precip anomalies for WY, MT, ID, NE CO with strong jet flow.

Valid: 7/7

Notice the abnormally strong Subtropical Jet running west to east from the Pacific to CA, NV, UT, CO. This will keep the Monsoon suppressed. WY, MT, ID, NE CO stay wetter than normal if this plays out.

High Peaks Forecast

Longs Peak, CO

6/30: Front, AM dry, PM 80% t-storm/rain/snow, 15-25mph gusts.

7/1: AM dry, PM 20% t-storm, 15-20mph.

7/2: AM dry, PM 40% t-storm, 15-30mph.

7/3: AM dry, PM 20% t-storm, 15-30mph.

7/4: AM dry, PM 40% t-storm,15-30mph.

Mount Sneffels, CO

6/30: AM dry, PM 20% t-storm, 15-30mph gusts.

7/1: Dry, sun, 15-25mph.

7/2: AM dry, PM 10% t-storm, 15-35mph.

7/3: AM dry, PM 20% t-storm, 15-35mph.

7/4: AM dry, PM 20% t-storm, 15-35mph.

Grand Teton, WY
6/27-6/29: Unsettled, PM t-storm/rain/snow.

6/30: Dry, sun, 10-20mph gusts.

7/1: Dry, 10-20mph.

7/2: Dry, 15-35mph.

7/3: AM dry, PM 20%, 15-35mph.

7/4: AM dry, PM 20%, 15-35mph.

Mount Superior, UT

6/30: AM dry, PM 30% t-storm, 15-30mph gusts.

7/1: Dry, sun, 15-25mph.

7/2: AM dry, PM 10% t-storm, 15-35mph.

7/3: AM dry, PM 10% t-storm, 15-25mph.

7/4: AM dry, PM 30% t-storm, 10-25mph.

Mount Rainier, WA

6/30: Dry, sun, 20-35mph gusts.

7/1: Dry, sun, 25-35mph.

7/2: Dry, 20-30mph.

7/3: Dry, 15-25mph.

7/4: Dry, 15-25mph.

Red Rocks Hail Event 6/21

Summary: Quarter to golfball sized hail hit Red Rocks Amphitheatre around 9:30pm on 6/21. Authorities are reporting about 100 injuries. The atmosphere was primed. All major atmospheric ingredients were in place for severe thunderstorms with large hail, flash flooding, and tornadoes. The forecast timeline was 4pm to 10pm. A Severe Thunderstorm Watch was in effect. The Storm Predication Center (SPC) issued an “Enhanced Severe Weather Outlook” for Denver, Front Range, and Eastern Plains. This is a serious issuance. Dewpoints were in the low 60s (measure of moisture in the atmosphere), which is high for Denver especially in June. Outflow boundaries were widespread all night.

Source of image is unknown.

Image from Ylan Milton.

Meteorology

Below is the radar summary between 9pm and 9:50pm.

Here’s a static image at about 9:30pm. This is a severe thunderstorm with a significant hail column.

Below is the hail core that rolled right across Red Rocks Amphitheatre. It originated with a severe thunderstorm in the Foothills then dropped down in elevation across Lakewood and moved east into Denver. The orange represents the core of largest hailstones ranging from quarter to golfball sized.

Risk

Outdoor venues always have risk from severe weather. We see it during golf tournaments, and organized running/biking events especially in mountainous terrain (like Pikes Peak Ascent/Marathon, Leadville 100 events, Devil on the Divide, etc). You might recall the ‘DC 50mile Ultra” in Utah back in October 2021 when a foot of snow hit racers. A reported 87 racers were helped off the course.

I regularly work for Race Directors of these events providing a forecast and observe day-of weather. Most of the time nothing happens – the radar is clean and clear. But, occasionally, especially with afternoon/evening events, the weather can increase risk.

The key question is this: Do you have a plan?

Pattern through July 1; Monsoon Season Preview

Tomer’s Take: The pattern is transitioning across the West. The abnormally wet pattern is moving out while more normal, warmer weather is moving in. This will introduce a drier period for the West until Monsoon Season kicks in. My opinion is that Monsoon Season will start about 1-2 weeks behind schedule. Normal Monsoon Season runs July-August.

PNW Snow

Mount Rainier has seen off/on snow the last few days. Notice the reduced visibility this morning at Camp Schurman and the team of climbers ascending in the distance – summit temps are in the single digits:

Mount Rainier Forecast:

6/20: Cloudy, PM 1-2 inches, AM 20mph, PM 30mph, 3/8F.

6/21: AM dry, sun, PM 1 inch, 15-20mph, 8/14F.

6/22: AM dry, sun, PM 1-2 inches, AM 15mph, PM 20mph, 14/17F.

6/23: AM dry, sun, PM 2-3 inches, AM 15mph, PM 25mph, 17/19F.

New Pattern

Higher pressures are gradually building in across the West replacing a persistent trough of low pressure and strong Subtropical Jet Stream. It’s a dramatic shift underway!

Here’s a forecast contrast. It shows the mid-atmospheric pressure anomalies from June 18 versus forecast valid July 1.

Valid: June 18 vs. July 1

Moisture Forecast

Precipitation anomalies return to normal end of June and early July.

Valid: July 1

Monsoon Preview

I believe the Monsoon will run about 1-2 weeks behind schedule. The flow turns southerly and starts adding moisture around July 10. The Climate Forecast System suggests small moisture anomalies between July 9-July 19, 2023. This would represent the start of the Seasonal Monsoon. It adds extra moisture across NM, AZ, UT, CO, WY, ID, MT fueling afternoon rain and thunderstorms with extra lightning, hail, and flash flooding.

Valid: July 9-19.

Weekend Mountain Weather, Snow for PNW, July 1 Forecast

Tomer’s Take: An abnormally wet June continues through this weekend across parts of the West with widespread afternoon rain/thunderstorms. A large trough moves into the PNW 6/17-6/21 with high wind and snow for the high Cascades and Volcanoes. Looking down the road, drier weather moves into the West late June through early July with a large dome of high pressure. The Monsoon appears to be running behind schedule.

Current Setup

It’s a clear morning on Mount Rainier, but clouds and wind will be increasing rapidly today. It’s going to be an unsettled period ahead with a large trough of low pressure moving in. Here’s the view from Camp Schurman:

It’s a cloudy morning in Colorado. The atmosphere is primed for heavy afternoon precipitation. The view from 13,000ft looking West/Southwest from Arapahoe Basin:

Pikes Peak is loaded with snow. It’s been an abnormally snowy Spring with a few different intense precipitation events.

Below is a live cam from 6/16/2023 showing deep snow on the summit.

Why So Wet?

The Subtropical Jet Stream remains strong and influential. The door is wide open for moisture transport across the West helping to fuel afternoon rain/thunderstorms.

Below is the Global Forecast System’s jet stream forecast valid 6/17/2023. I marked the Subtropical Jet Stream below:

PNW Trough

An abnormally large trough drops into the PNW 6/17-6/21 riding the northern jet branch. This introduces rain/snow/wind for the high Cascades and Volcanoes.

Below is the Global Forecast System’s atmospheric pressure anomalies mid-atmosphere valid 6/18/2023. Pressure anomalies in the PNW are running 2-3 standard deviations below the 30-year norm.

Moisture Forecast

Two surges of atmospheric moisture are likely this weekend. Below you can see both ribbons of precipitable water anomalies valid 6/17/2023.

July 1

Late June and early July look more normal across parts of the West with a large dome of high pressure taking over. The precipitable water anomalies paint a clear picture. This doesn’t mean it’s totally dry, but rather a return to a more normal precipitation pattern.

This might also be a sign that the seasonal Monsoon is running behind schedule. It typically runs July-August.

Valid: July 1, 2023

Notice the large dome of high pressure valid June 27, 2023 lasting into early June.

Below the Global Forecast System believes higher atmospheric pressure anomalies are likely.

High Peaks

Mount Rainier, WA, Summit Level, Max Gusts (AM/PM), Precip

6/16: 30/55mph, PM Light Snow

6/17: 20/40mph, Dry

6/18: 55/25mph, PM Snow

6/19: 15/30mph, PM Snow

6/20: 25/25mph, Snow

Longs Peak, CO, Summit Level, Max Gusts (AM/PM)

6/16: 20/20mph, PM Heavy Snow

6/17: 20/30mph, PM Snow

6/18: 30/40mph, Dry
6/19: 30/30mph, Dry

6/20: 25/40mph, Dry

Mount Superior, UT, Summit Level, Max Gusts (AM/PM)

6/16: 25/25mph, PM Light Snow

6/17: 10/30mph, Dry

6/18: 35/50mph, PM Rain Shower

6/19: 35/55mph, PM Rain Shower

6/20: 50/25mph, AM Light Snow

El Nino is here: What to expect across the West

Tomer’s Take: El Nino has arrived. The triple-dip La Nina is over. Bottom line, El Nino is here through Winter 2024.

The La Nina for a generation

The 2022-2023 La Nina delivered big time to CA, UT, and CO. In fact, it overdelivered. It overperformed in ways not seen in historical records. It was a La Nina for the generations. We saw a roughly 20-day atmospheric river (AR) nail the Sierra and Interior Rockies. A mega-March delivered record amounts of snow/snow-water-equivalent to UT.

La Nina/El Nino are just patterns. They are not comprehensive. They help guide the forecast but there’s always room for change.

Notables

Season Totals: 

Mammoth Base: 715″ (all-time record).

Palisades Tahoe: 723″ (all-time record).

Alta, UT: 903″ (all-time record). <–That’s 73 Feet

Brighton, UT: 878″ (all-time record).

Solitude, UT: 816″ (all-time record).

Latest Forecast

The red bars indicate El Nino. Bottom line, it’s here to stay through Winter 2024.

Current Sea Surface Temperature Anomalies

Red indicates warmer than normal sea surface temps. El Nino is characterized by warmer than normal water in the South Pacific near the Equator.

Where we’ve been

The blue represents La Nina; red is El Nino. We’re currently exiting from a triple-dip La Nina (3 straight Winter Seasons).

A zoomed-in version more recently:

Last two year’s of model forecasts: Below the black line equals La Nina (colder water temps). Now we’re headed up to warmer water temps (El Nino).

Current Model Forecast Spread

Most major Global models indicate El Nino is coming. Some indicate a ‘Strong El Nino’. +0.5C is the threshold for El Nino.

Forecast: El Nino and Severe Weather

El Nino tends to decrease hail and tornado risk while La Nina tends to increase the risk. A neutral phase can fall right in the middle with regard to risk.

Data/Graphics via Climate.Gov

Forecast: El Nino and Indian Monsoon

This is from older data but still applicable. El Nino tends to disrupt the Indian Monsoon.

Forecast: North American Monsoon

The data is more subtle for the Southwestern United States.

La Nina might lead to above average July-August precipitation.

El Nino might lead to below average July-August precipitation.

Typical El Nino Impact Pattern

We’re already seeing this abnormally strong Subtropical Jet. It’s why parts of the West have been so wet the last 1.5 months. In fact, record amounts of rainfall have occurred in Colorado.

Will this pattern persist into Winter 2024? Yes, in all likelihood.

Graphic courtesy NOAA.

What about Colorado Winter 2024?

The pattern above is likely, but I’ll drill-down more by mountain zone in the coming weeks.

Rain totals last 30 days; What’s next?

Tomer’s Take: Parts of Colorado are soaked after record rainfall totals over the last 30 days. Some places are pushing a foot of rainfall. The pattern stays wetter than normal through June 15 then returns to a “normal” precipitation pattern after June 15 through June 30.

Denver Front Range

Accumulated precipitation May 1 – June 6, 2023. Denver averaging 7-9 inches.

Northern Colorado

Fort Collins averaging 6-8 inches.

Colorado Springs

This fell as snow on Pikes Peak with an estimated 3-4 feet of accumulation.

Salt Lake City. Drier than normal. Some of this fell as snow at higher elevations.

Lake Tahoe/Reno. Some of this fell as snow at higher elevations. Wetter than normal.

Record Moisture

May 2023:

Across the West:

Why Is This Happening?

An abnormally strong Subtropical Jet is escorting extra moisture and areas of low pressure directly into the West.

What’s Next?

Valid June 6 – June 16 from the Climate Forecast System, total precipitation percentage of normal. Notice the blue bullseyes over most of the West representing 150-400% of normal precipitation.

A return to “normal” precipitation occurs after June 15. It’s most pronounced June 20-30. Notice the blue bullseyes are largely gone.

Update: Wet June Forecast

Tomer’s Take: May and now June are wetter than normal across parts of the West. I’m forecasting wetter than normal conditions through June 15 then the pattern gradually returns to ‘normal’ precipitation late June. The effects are more pronounced June 20-30 just before the seasonal Monsoon.

Precipitation Last 30 Days

Percentage of average valid 5/5-6/3: The areas in blue and purple represent 150-400% of average precipitation.

Take a closer look at Colorado: Most of the Divide and East are 150-300%+ of average. Soaked.

Drought Impact

All this precipitation (rain+snow) has significantly reduced the Western Drought. Look at this before (December 27, 2022) versus after (Current Day) slider:


Why is this happening?

We’re making a hard transition from three straight years of La Nina (‘Triple-Dip’) into El Nino. I believe this is contributing to an abnormally powerful SubTropical Jet Stream. It opens the door for precipitation transport into the Western United States. Notice below it acts like conveyor belt ushering in areas of low pressure.

Forecast: Precipitation Through June 15

Valid through 6/18 from the Climate Forecast System. Notice the blue bullseye over most of the West. That equates to 150-400% of normal total precipitation. This is not normal for June.

Forecast: Late June

Valid 6/18-6/28 from the Climate Forecast System. Notice the blue bullseye is gone and is replaced by light to dark green colors. Ultimately this means less precipitation but not totally dry. This is a return to more ‘normal’ conditions.

Summary

  • Wetter than normal forecast early to mid June.
  • Drier with normal precipitation late June.
  • Seasonal Monsoon normally engages July-August.

Update: June Looks Wet

Tomer’s Take: I’m forecasting above normal early to mid June precipitation for most of the West with a powerful Subtropical Jet Stream. But, what above mid to late June? Data points to drier air for a few states including CO, WY, NM, AZ.

Rich Flow with Subtropical Jet

Valid 6/10: This is not normal for June. This reminds me of the powerful Atmospheric River pattern we saw over the Winter. What you’re seeing is an active and strong Subtropical Jet Stream ushering in rich moisture (and areas of low pressure) across the Intermountain West. This makes afternoon rain and thunderstorms more likely.

Early to Mid June Precipitation Totals

The Climate Forecast System paints a 100-400% bullseye (green and blue colors) across parts of the West. This means precipitation totals will run 100-400% above normal. This includes CA, OR, ID, WY, MT, UT, CO, and possibly NM & AZ. And yes, some light snow is possible early to mid June above 12,000ft.

Mid to Late June Precipitation

The pattern turns gradually drier (tan and brown colors) across CO, NM, AZ, and WY. The precipitation bullseye backs West and stays prominent in CA, OR, NV, and parts of UT.

Conclusion

What does this ultimately mean? Anyone recreating at high elevations needs to pay close attention to midday/afternoon thunderstorms with lightning and heavy downpours. Also, heavy rain each afternoon will add to snowpack snowmelt flowing into rivers and streams.

June Looks Wet

Tomer’s Take: I’m forecasting a wetter than normal start to June across the Intermountain West. Why? Extra moisture from the Gulf of Mexico and Pacific Ocean will flood the atmosphere. The door is wide open at all key atmospheric levels. Precipitable water anomalies run 100-300% of normal. This extra moisture fuels widespread afternoon rain and thunderstorms. This will hold temperatures down.

Light snow is possible above 12,000 feet in Colorado, Utah, and Wyoming between Thursday (6/1) and Friday (6/2).

Normally, mid to late June offers some of the driest air of the year but that could be in jeopardy.

Rich Flow

Valid 6/3/2023: Forecast precipitable water anomalies run 100-300% of normal in CO, WY, MT, ID, UT, NV, AZ, and NM (green and blue shades). This pattern stays entrenched through at least 6/9.

Powerful Subtropical Jet

Valid 6/2/2023: This opens the door to extra moisture and areas of low pressure to hit the Intermountain West.

Lower Pressures Dominate

Valid 6/7/2023: A deep trough over the Southwest and Southern States keeps unsettled weather locked-in. If this pattern doesn’t change then expect a continuation of above normal precipitation into mid June.

Total Precip June 3-13

Total precipitation across the Intermountain West could run 300-500% of normal in the blue shaded areas (via Climate Forecast System). This is an incredible bullseye for June.

Forecast Freezing Level

Southern Mountains of Colorado, Daily Max/Min:

5/30: 14600’/13300′

5/31: 14600’/12100′

6/1: 13000’/10800′

6/2: 12300’/11600′

6/3: 13300’/12100′

6/4: 14800’/13600′

Wasatch Mountains, Utah:

5/30: 13600’/12800′

5/31: 13600’/13300′

6/1: 13100’/12800′

6/2: 13100’/12300′

6/3: 13500’/12300′

6/4: 14300’/13300′

Forecast Timing

Forecast radar/satellite valid 5/30-6/3.

Weekend Mountain Weather update; Early June Looking Wet

Tomer’s Take: Forecast freezing levels stay elevated. This forces the snowpack to continue melting across the West. I’m also forecasting afternoon thunderstorms almost every single day across the Intermountain West with a rich feed of moisture. Early June could be wetter than normal.

11:30am view from Vail looking East/Northeast across the Gore Range. Snow continues melting and you can see the daily thunderstorms developing.

Forecast Freezing Level

Colorado’s Central Mountains, Daily Max/Min:

5/26: 14100’/12100′

5/27: 14400’/12100′

5/28: 14100’/12500′

5/29: 14900’/13100′

Wasatch Mountains, UT:

5/26: 13000’/12300′

5/27: 12500’/11600′

5/28: 13600’/12600′

5/29: 13500’/13000′

Teton Range, WY:

5/26: 12000’/11600′

5/27: 11500’/11300′

5/28: 12300’/11000′

5/29: 13300’/12500′

Rich Moisture Feed

Afternoon thunderstorms are likely each day through the end of May. This pattern will likely continue into early June and of course July-August.

In addition, we’re seeing extra moisture flood the atmosphere over the Intermountain West making afternoon thunderstorms even more likely.

Below is forecast precipitable water percentage of normal anomalies valid June 3, 2023. The green and blue represent 100-200% of normal.

Early June Looking Wet

The Climate Forecast System (CFS) is predicting 200-300% off normal precipitation across most of the West. Valid May 31-June 10:

Severe Weather Season

In Colorado, we’re in severe weather season. It’s when the odds are stacked for severe hail, wind, and tornadoes.

This chart is courtesy Dr. Russ Schumacher (State Climatologist).

Lightning – Weather Killer

Lightning is the number one weather killer in Colorado. Expect it each afternoon especially over the Mountains.

Statistics below pertain to Colorado.