Tomer’s Take: The atmospheric river (AR) continues through 1/11 with the biggest impacts in CA, WA, OR. A moderate intensity AR surge occurs in CA 1/4-1/5. This storm impacts UT, WY, ID, CO on 1/5-1/6. There appears to be another moderate intensity AR surge for CA/West Coast on/around 1/10.
7-Day Totals:
Brighton, UT is reporting 80 inches in the last 7 days.
Kirkwood, CA is reporting 74 inches in the last 7 days.
Alta, UT is reporting about 69 inches in the last 7 days.
Palisades Tahoe, CA is reporting 69 inches in the last 7 days.
Wolf Creek, CO is reporting 42 inches in the last 7 days.
Steamboat, CO is reporting 35 inches in the last 7 days.
Alta, UT has officially surpassed 300″ for the season so far.
The morning view at Palisades Tahoe before the next AR surge on 1/4-1/5.

My forecast video 1/2:
Current Setup
Infrared satellite shows the Pineapple Express flow with areas of low pressure lined-up. The big low in the northern Pacific (north of HI) hits CA/West Coast 1/4-1/5 with moderate level AR intensity.

Forecast Pattern
Forecast jet stream valid 1/11. The flow continues to favor CA, WA, OR for biggest AR impact. The jet is choppy for the interior Rockies with less snow accumulation.

Atmospheric River
The long term forecast for AR is below from the GEFS model. You’re looking at forecast IVT plumes/transport across latitudes. It includes two more moderate intensity surges for CA, WA, OR. These are represented by the brighter colors (yellows, oranges, reds). The first is 1/4-1/5. The second is on/around 1/10. The AR surges beyond 1/10 are not as robust but could still be weak intensity AR surges. Bottom line, the above average precipitation continues for the West Coast beyond 1/10.
I worry about catastrophic flooding in the Northern California.

Forecast Timing
Forecast radar/satellite valid 1/2-1/7.
Forecast Totals
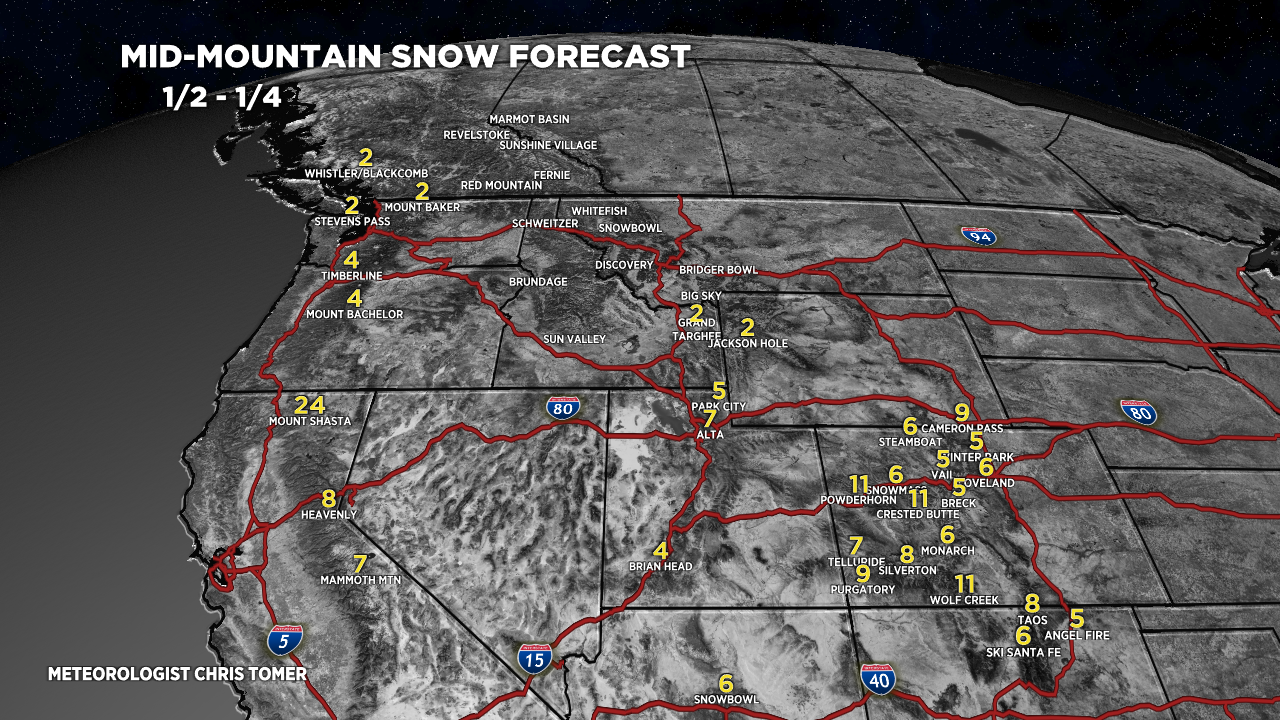
Forecast snow totals (inches) valid 1/2-1/4.

Forecast snow totals (inches) valid 1/5-1/11.

Snow forecast timeline for Mammoth Mountain, CA.
- 1/2: 1″
- 1/3: 1″
- 1/4: 5″
- 1/5: 14″
- 1/6: 0″
- 1/7: 0″
- 1/8: 0″
- 1/9: 6″
- 1/10: 20″
- 1/11: 9″
Forecast snow totals (inches) valid 1/2-1/11.
